Discrete Fourier Transform (DFT)
DFT transforms an ordered sequence of data samples (usually in the time domain) into the frequency domain to make spectral information about the sequence explicit:

In general, the DFT is a complex function of a complex variable.
Commonly, the variable being transformed is real but the DFT results will be complex, conveying information about the magnitude and phase spectra:

Assume that a real data sequence of N samples:
\![]()
is transformed using the DFT. The result will be a set of N/2+1 complex numbers:

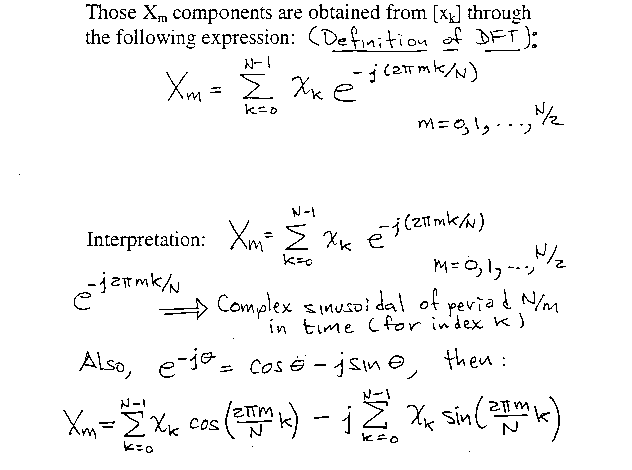
where the m is an index of frequency for each Xm.

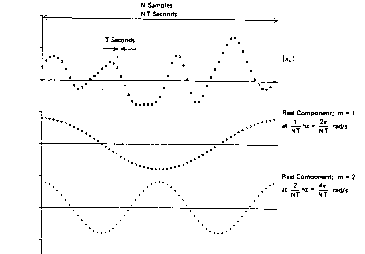
So, each of Xm expresses in its real and imaginary parts the "correlation" (summed product, revealing the "fit" of one signal with another) of the data sequence [Xk} with a cosine and a sine of period N/m samples.

So, each Xm in the DFT reflects the "fitting" of the original sequence [Xk} with a cosine or a sine at each of those "test" frequencies m/(NT).
The frequency of the last Xm term is: (for m = N/2):
(N/2)/NT = 1/2T = 0.5(1/T) = (0.5)(fs)
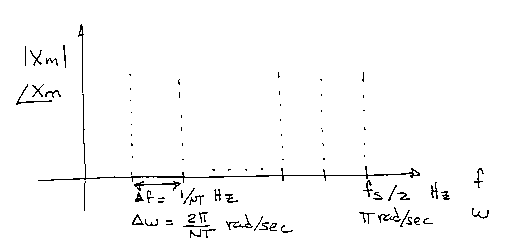
Then, the N/2 + 1 frequencies being "test" against [Xk} span from 0 to fs/2 at intervals ("frequency resolution") of Df = (1/NT) Hz or Dw = (2p/NT) rad/sec.

Since the Xm are complex numbers:
Xm = | Xm | e^(jfm)
either their magnitude or their phase can be plotted versus the discrete frequency scale, resulting in the "magnitude spectrum" and the "phase spectrum" of [Xk}, respectively.
Redundancy in the DFT:
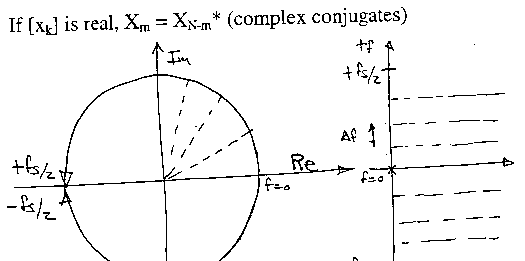
Xm = Xm+N for [xk} real or complex.
(X0 to XN-1 is a complete set of DFT components)

| Previous: Interpretation of Z-Transform | Next :Inverse DFT |